
Using gnuplot, Zener diode behaviour
gnuplot is a nice tool for plotting data. Start gnuplot to enter plot commands. I tried this tool when analyzing a strange behaviour of a Zener diode. In the end it turned out that there was no strange behaviour.
Data file. Values separated with whitespaces:
Current [mA]    Vin     Vzener
0.100   2.420   2.396
0.200   2.710   2.652
0.300   2.894   2.862
0.400   3.038   2.911
0.500   3.158   2.997
0.600   3.260   3.068
0.700   3.359   3.130
0.800   3.447   3.183
0.900   3.528   3.231
1.000   3.605   3.274
1.100   3.678   3.313
1.200   3.748   3.349
1.300   3.816   3.382
1.400   3.880   3.413
1.600   4.005   3.469
1.800   4.123   3.519
2.000   4.236   3.564
2.200   4.344   3.604
2.400   4.450   3.641
2.600   4.552   3.675
2.800   4.652   3.707
3.000   4.748   3.735
3.200   4.843   3.763
3.400   4.938   3.788
3.600   5.030   3.813
3.800   5.120   3.835
4.000   5.210   3.857
4.200   5.300   3.877
4.400   5.386   3.896
4.600   5.472   3.915
4.800   5.558   3.933
5.000   5.643   3.949
6.000   6.057   4.023
7.000   6.459   4.084
8.000   6.849   4.135
9.000   7.234   4.180
10.000  7.614   4.220
15.000  9.462   4.365
Plotting the data
I want to output two curves (Vin, Vzener), x-Axis is first column of data file (here: Current [mA]).
Background for this graph: This graph shows regulated voltage at a Zener diode, as a function of current through the diode. Vin is Input voltage coming in at a shunt resistor of 330 ohms.
For an ideal Zener diode, on increasing Vin, the Vzener should also increase, up to the hard limit of the Zener voltage, here 3.3 volts. When Vin is further increased, output voltage (Zener voltage) should stay fixed on zener voltage 3.3 volts, so we should see a horizontal line for that part of the graph.
A real world Zener looks different.
Next line shows my plot command:
gnuplot

gnuplot> plot "zener.dat" using 1:2 title 'Vin' smooth bezier lw 2, \
  "zener.dat" using 1:3 title 'Vzener' smooth bezier lw 2, 3.3 title "3v3", 3.9 title "3v9
lw 2 means line width. using 1:2 means ‘use column 1 as x-axis and
column 2 as y-Axis for curve/plotline named “Vin”’. smooth bezier means
connect the graph points with some interpolating function (e.g. bezier).
All curves are speparated by a comma. There are two horizontal lines, for special values (3,3 and 3,9 volts.).
Grid:
gnuplot> set grid
Vertical line:
gnuplot> set arrow from 5,0 to 5,10
Result:
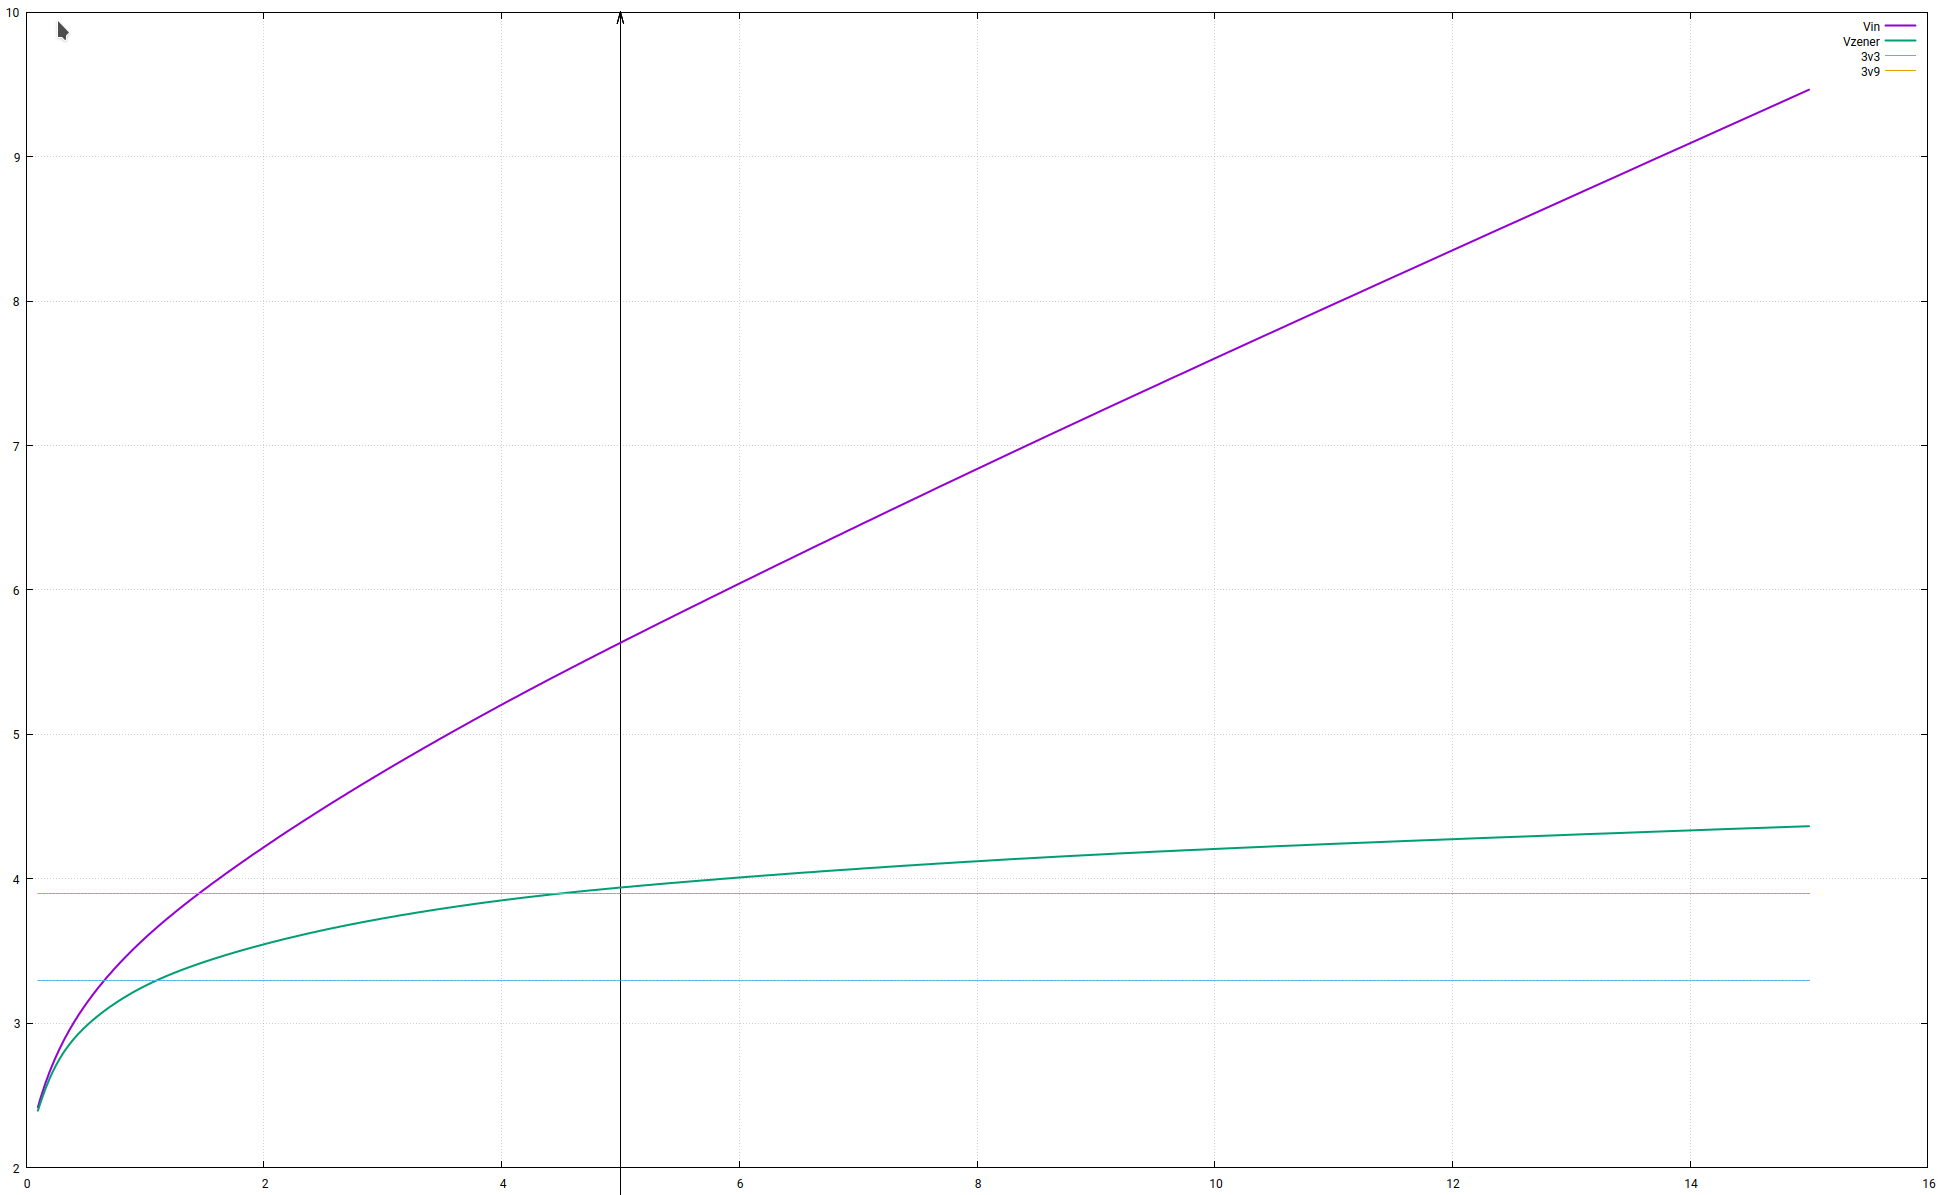
Background regarding the plot: This is a data curve from a Zener diode. I bought it as a 3,3 volts zener. Seller named it “ZF 3.3”, I found out that it should be a BZX79C 3V3.
This diode, for the 3V3 type, should regulate between 3.1 and 3.5 volts, when a current of 5mA runs through the diode.
I measured zener voltages at current values between 0.1 and 15 mA. Data set consists of 39 samples, each consisting of a current value (used for X axis), an input voltage at 330 ohms shunt resistor called Vin, and zener output voltage, measured between Kathode and Anode of diode, called Vzener.
At target current value of 5mA this diode regulates to 3.949 volts. So, from the results, it looks that this is not a 3V3 type, but a 3V9 type.
Under microscope, I finally found that this is in fact a 3V9 diode. It was a BZX55C 3V9 that somehow found its way into the 3V3 box.
Look at a real 3V3 diode
After that I took a real 3V3 diode (again BZX79C 3V3, but now a correct one).
Current [mA]    Vin     Vzener
0.1 1.942      1.918
0.2 2.182   2.123
0.3 2.337   2.243
0.4 2.461   2.331
0.5 2.567   2.402
0.6 2.661   2.461
0.7 2.748   2.513
0.8 2.828   2.557
0.9 2.903   2.597
1   2.976   2.634
1.1 3.044   2.667
1.2 3.110   2.697
1.3 3.175   2.727
1.4 3.237   2.753
1.5 3.298   2.779
1.6 3.358   2.803
1.7 3.415   2.825
1.8 3.471   2.846
1.9 3.530   2.869
2   3.585   2.888
2.2 3.694   2.923
2.3 3.728   2.940
2.4 2.776   2.956
2.6 3.879   2.988
2.8 3.961   3.010
3   4.053   3.037
3.2 4.146   3.062
3.4 4.243   3.087
3.6 4.34    3.110
3.8 4.43    3.131
4   4.515   3.151
4.2 4.615   3.174
4.4 4.705   3.193
4.6 4.873   3.211
4.8 4.843   3.21
5   4.925   3.226
6   5.348   3.301
7   5.759   3.362
8   6.168   3.419
9   6.568   3.465
10  6.966   3.51
15  8.990   3.677
And the graph:
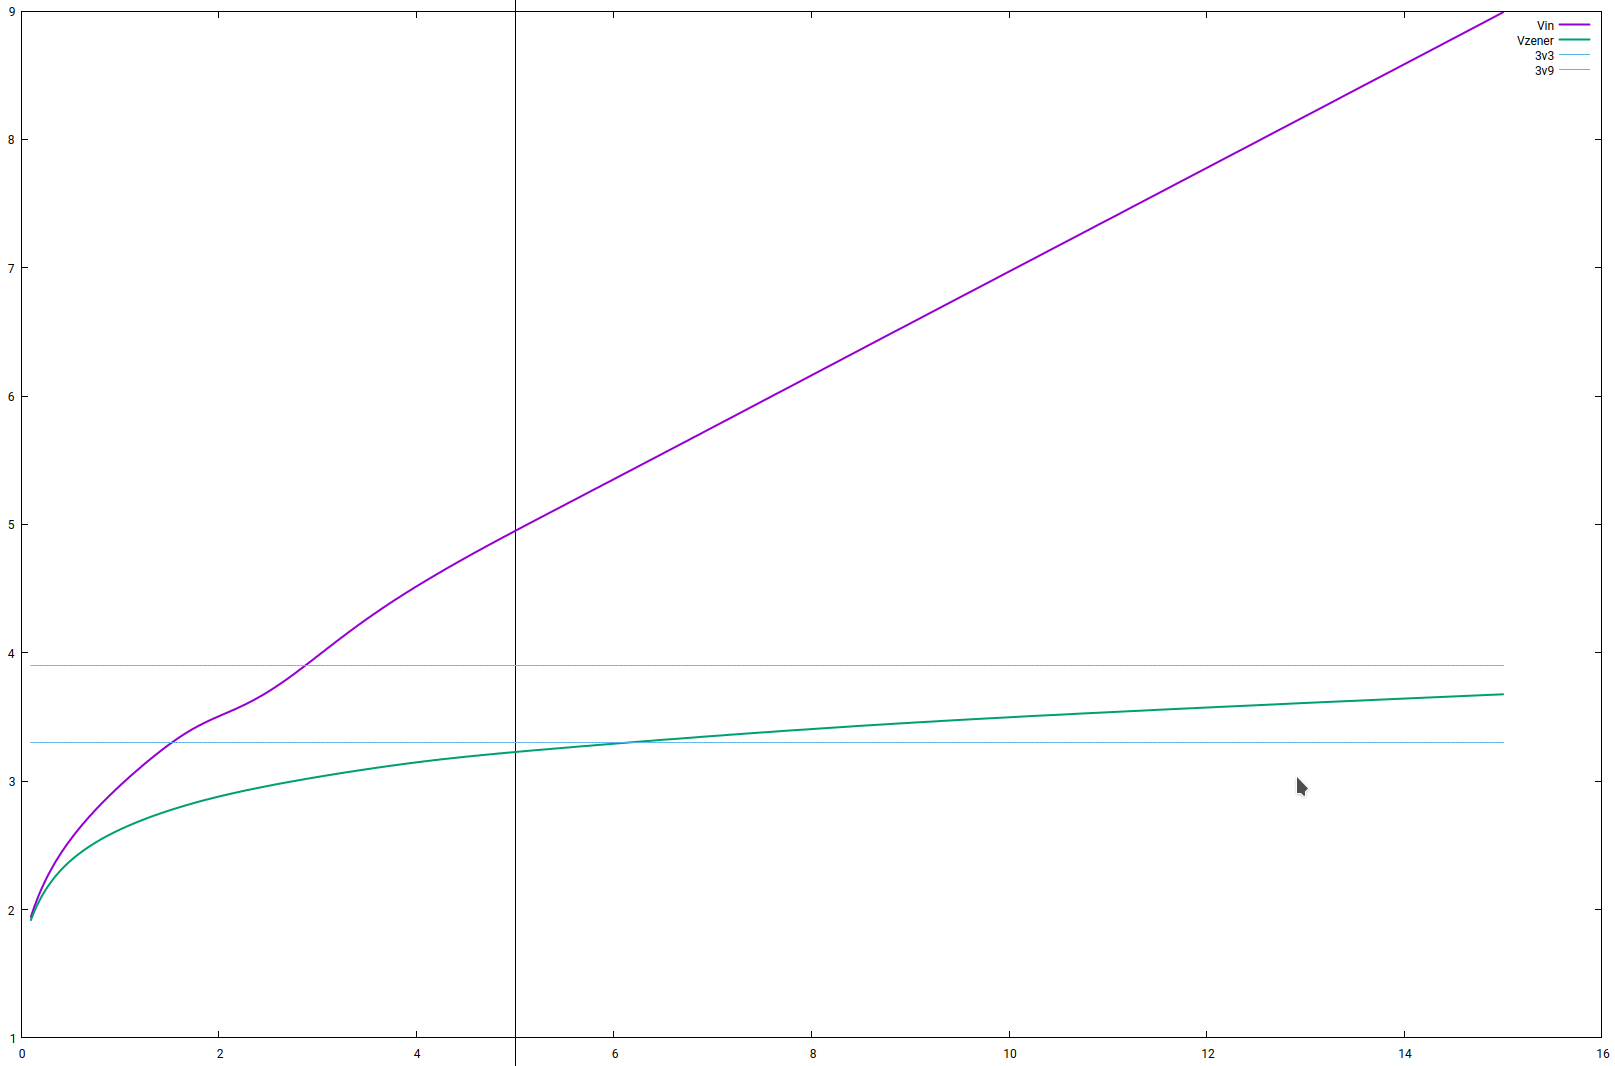
It can be seen that for 5mA, a voltage of 3.226 is regulated, well inside datasheet margins for a 3V3 type.
Related
Discussion of the Zener “issue” - https://www.eevblog.com/forum/beginners/question-in-z-diode-behaviour/